




Energy Awareness
Environmental Impact
System Status
Data Center
Building Comparison
Energy Tracking



Energy Reduction Initiatives
A university campus utilizes
Vantage Point displays to track
building energy consumption.
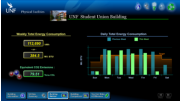
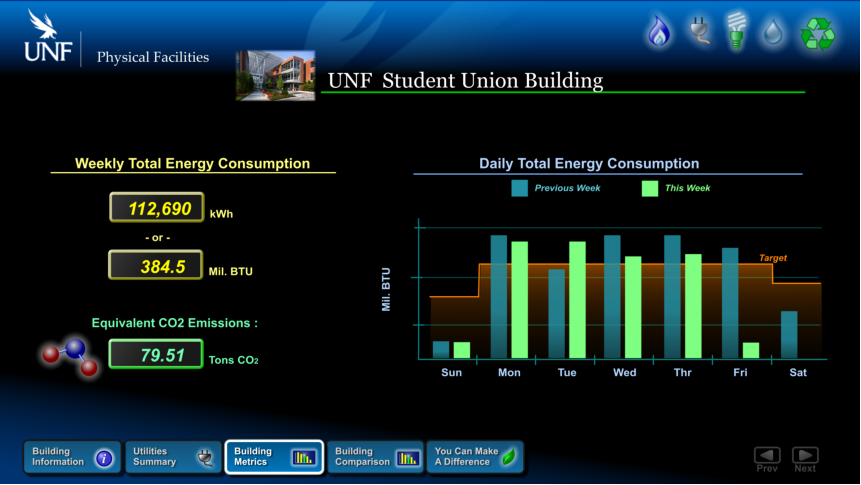
A Bar Graph component is used to
compare daily energy totals to
target levels.
Multiple panels in the presentation
cycle through automatically.
A person viewing the presentation
can also use the navigation
hotspots at the bottom to select an
individual panel.
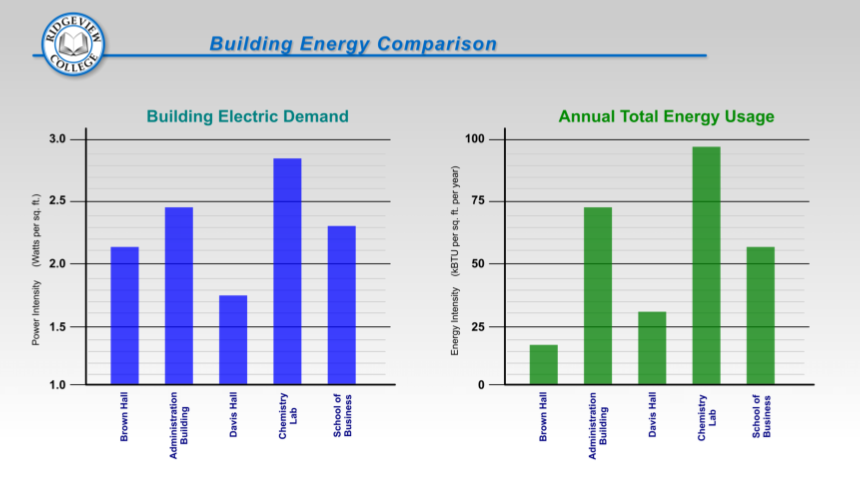

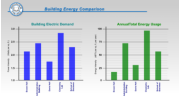
Building Comparisons
Vertical Bar Gauges linked to
power and energy for individual
buildings are used to compare
building performance side-by-side.
Vantage Point polls for live values
of electric power, constantly
updates the bar gauges for
demand.
Calculated points can be used to
display values normalized on a
‘per building area’ basis.
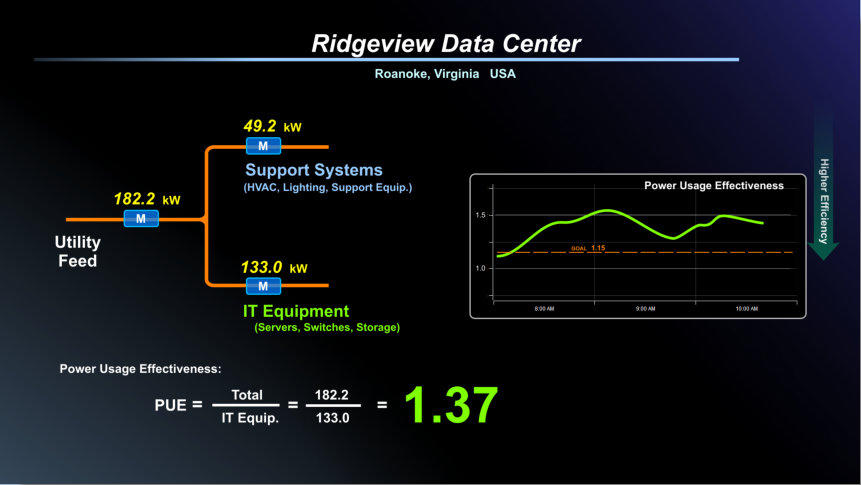

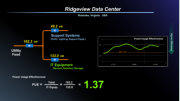
Data Center Application
Power Usage Effectiveness (PUE)
is important in Data Center
operations.
This Vantage Point panel displays
and tracks PUE in real time with
data polled from multiple power
meters.
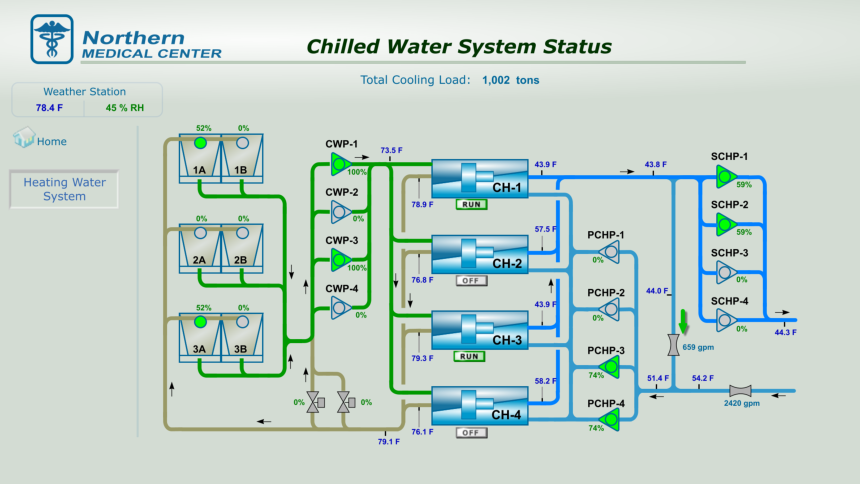

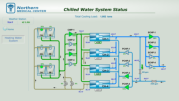
Detailed System Displays
Graphic views of entire systems
can display many points at
once.
All data points are polled from
an existing Building Automation
System using BACnet protocol.
Values are updated and
displayed in real time.
Navigation to other panels is
offered through graphic hotspots
that work with mouse click or
touchscreen.
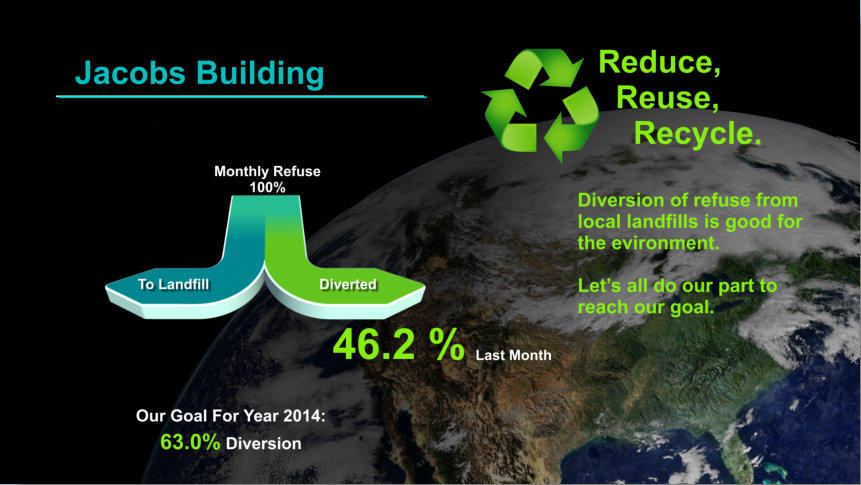

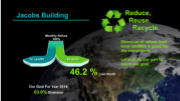
Impact on the Environment
A lobby display reminds building
occupants of a corporate
initiative to encourage reducing
their impact on landfills.
Monthly tracking numbers for
diverted content are displayed
and compared to goals.


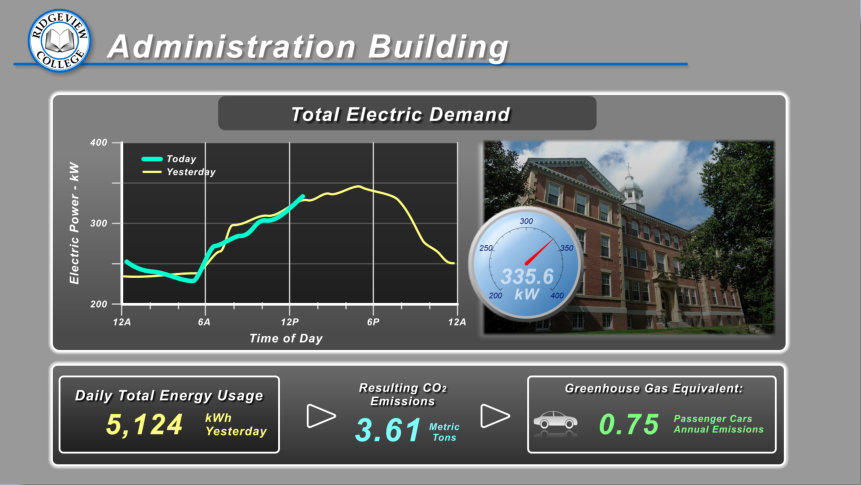
Energy Awareness
Allow building occupants to see
their total energy consumption
and its effects on the
environment.
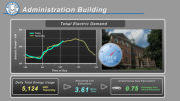
In this example, data from the
building’s main electric meter is
displayed in real time.
Calculated points are created in
Vantage Point to equate energy
to equivalent greenhouse gas
emissions.
Energy awareness is an
important first step in any
energy savings initiative.


